Welcome to the ultimate guide to Gantt charts! If you’re new to project management or simply curious about this magical tool, you’re in for a wild ride. We’ll demystify Gantt charts, unveil their core purpose, explore their essential components, and dive into their real-world applications. And don’t worry, we’ll also help you master the utilization of these charting wonders. So buckle up and let’s get started!
Demystifying Gantt Charts: Definition and Evolution
Before we can conquer the world of Gantt charts, we need to understand what they are and how they’ve evolved over time. Picture this: it’s the late 19th century, and a shining knight named Henry Gantt, hailing from the land of management consulting, unleashed this visual masterpiece upon us. A Gantt chart is a bar chart that illustrates a project schedule, with each bar representing a task or activity. It’s like a symphony conductor, waving their baton to keep the project in harmony.
But Gantt charts didn’t stop there. They evolved like a Pokémon, gaining new abilities with each generation. Now, they can track progress, visualize dependencies, and even calculate critical path—a fancy way of saying they can help you identify the most critical tasks that could cause your project to go up in flames if they’re delayed.
As Gantt charts continued to mature, they became the go-to tool for project managers worldwide. With their ability to break down complex projects into manageable tasks, they serve as a roadmap guiding teams towards successful project completion.
Moreover, in today’s digital age, Gantt charts have seamlessly transitioned from paper and pencil to sophisticated project management software. These digital wizards not only offer dynamic updates and real-time collaboration but also provide insightful analytics to optimize project performance.
Unveiling the Core Purpose of Gantt Charts
Why do we need Gantt charts in our lives, you ask? Well, picture yourself juggling a million tasks without a safety net. It’s like trying to catch a fly with chopsticks. Gantt charts swoop in like a superhero cape, providing clarity, structure, and order to your project timeline. They help you visualize milestones, plan resources, and keep everyone on the same page. And let’s not forget the ultimate advantage: they make you look like a project management rockstar.
Furthermore, Gantt charts are not just about timelines and tasks; they also serve as communication tools. By visualizing project schedules and dependencies, these charts facilitate discussions among team members, stakeholders, and clients. This transparency fosters collaboration, aligns expectations, and minimizes misunderstandings. In essence, Gantt charts are more than just colorful bars on a timeline—they are the backbone of efficient project management, empowering individuals and teams to achieve their goals with precision and finesse.
Essential Components of a Gantt Chart Explained
Understanding the Gantt Chart Grid
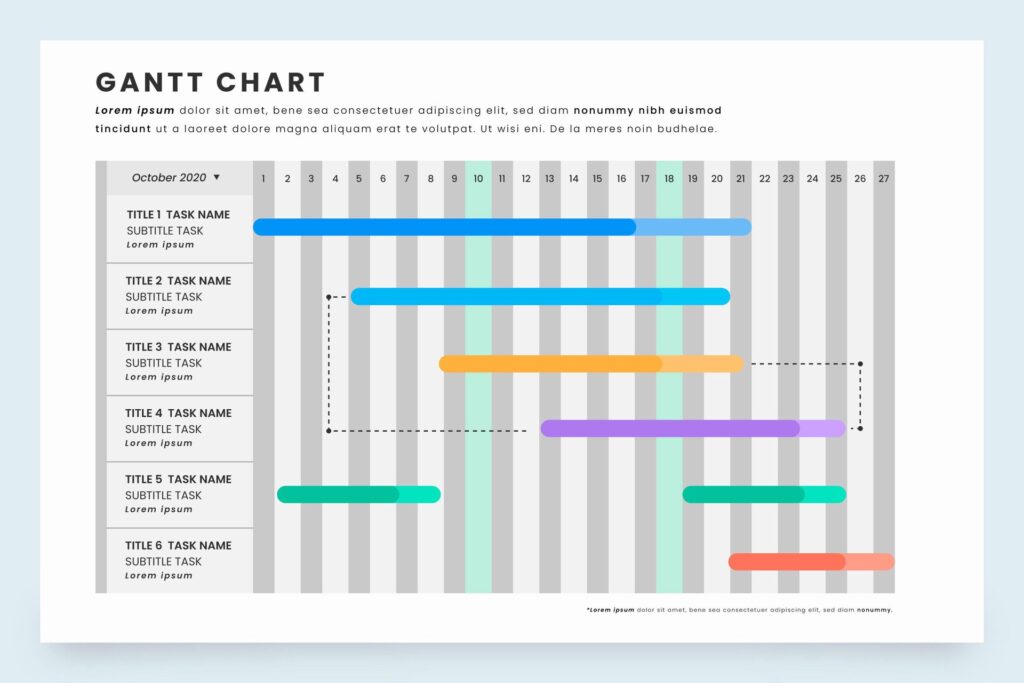
Every superhero needs their trusty sidekick, and for Gantt charts, that’s the grid. Imagine it as a city map with rows and columns. The rows represent tasks while the columns represent time. This nifty grid helps you assign tasks, set start and end dates, and spot any overlaps or gaps in your project schedule.
But be warned, the grid can be a maze if you’re not careful.
As you delve deeper into the intricate web of the Gantt chart grid, you’ll notice that each intersection of a row and column holds a treasure trove of information. It’s where tasks come to life, where deadlines loom large, and where the heartbeat of your project pulses. The grid is not just a static structure; it’s a dynamic landscape that evolves as your project progresses, guiding you through the twists and turns of project management.
Harnessing the Power of Gantt Charts in Project Management
Integrating Gantt Charts in Waterfall Planning
Waterfall planning, like the majestic flow of a waterfall, follows a sequential approach. It’s perfect for projects with well-defined requirements and fixed timelines. And guess what? Gantt charts and waterfall planning go together like peanut butter and jelly. Gantt charts help you break down your project into manageable tasks, assign resources, and track progress. So, dive into the waterfall, armed with your trusty Gantt chart, and conquer those projects with ease!
And there you have it—your ultimate guide to Gantt charts! We’ve journeyed through the definition, evolution, and examples of these project management wonders. We’ve explored their core purpose, essential components, and real-world applications. And most importantly, we’ve armed you with the knowledge to become a Gantt chart master.
So go forth and conquer the world with your newfound Gantt chart expertise. Gantt charts will be your trusted sidekick, guiding you towards project success. Happy charting!